CloudWatch Alarm Data - What am I Missing?
/3.png?width=200&name=3.png)
AWS CloudWatch Alarms give a simple way to raise alerts when systems are unhealthy. However, they require careful configuration - especially with how it treats missing data.
I recently reviewed a customer’s configuration for a HTTPCode_ELB_5XX_Count alarm. This can be a great multi-purpose alarm for if something goes wrong: detecting when the website or API has started returning a large number of 500 errors.
TL;DR: consider setting treat_missing_data = "notBreaching"; otherwise you could get false positives.
The Problem
The alarm was configured with:
HTTPCode_ELB_5XX_Count >= 100 for 8 datapoints within 10 minutes
and a period of 1 minute.
This is supposed to mean that there must be a high number of HTTP 500 errors for 8 out of the past 10 minutes before the alarm triggers.
However, the graph below shows that the number of errors was high for just one datapoint, followed by no data for the next nine minutes - then the alarm fired.
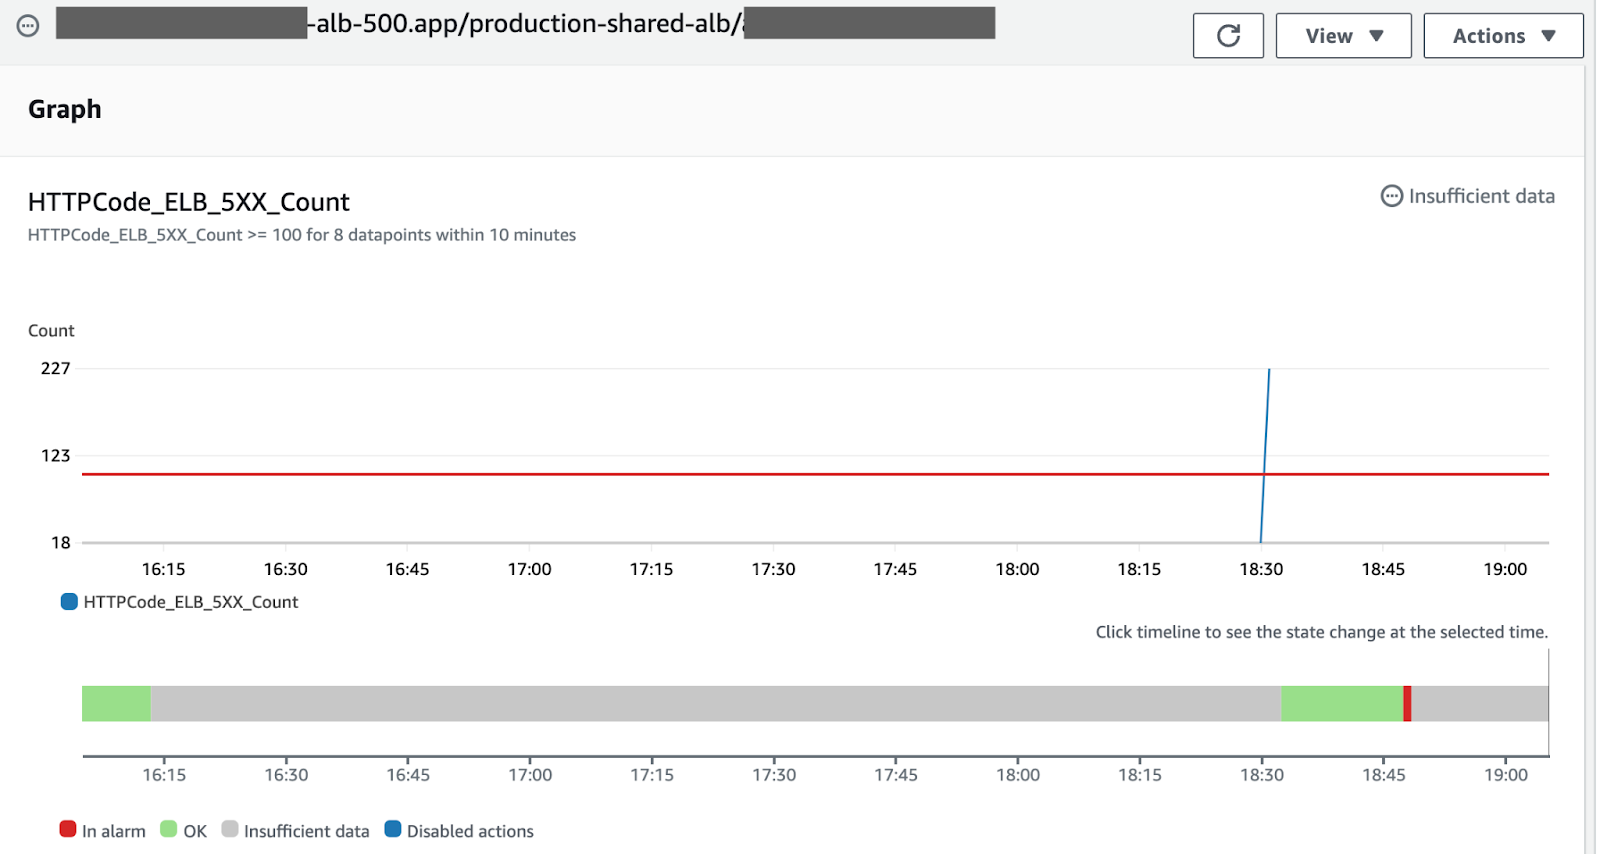
The issue here is that it is configured to “treat missing data as missing” (see the AWS docs for details). However, the metric HTTPCode_ELB_5XX_Count only generates data when there are errors (i.e. nothing is published when the value is zero).
The Resolution(s)
The fix in this situation is to “treat missing data as good (not breaching threshold)”.
Below is some example Terraform code for this alarm:
resource "aws_cloudwatch_metric_alarm" "alb500" {
alarm_name = "${local.name_prefix}-alb-500.${var.load_balancer_arn_suffix}"
comparison_operator = "GreaterThanOrEqualToThreshold"
datapoints_to_alarm = "8"
evaluation_periods = "10"
metric_name = "HTTPCode_ELB_5XX_Count"
namespace = "AWS/ApplicationELB"
period = "60"
statistic = "Sum"
threshold = "100"
treat_missing_data = "notBreaching"
alarm_description = "This metric monitors alb 5XX errors"
alarm_actions = var.sns_alarm_topic_urgent
dimensions = {
LoadBalancer = var.load_balancer_arn_suffix
}
insufficient_data_actions = []
}
Below are a few more things to be careful of:
- The right value of treat_missing_data very much depends on the metric. Some metrics will continually report data (e.g. CPUUtilization of an instance) in which case you might want to treat missing data as “breached”. The default in Terraform is “missing”. In the AWS console, the default is also “missing” with it hidden away under the “additional configuration” section - that’s not helpful!
- Be careful with the naming/spelling of your metric. If you reference a non-existing metric (particularly with treat_missing_data="notBreaching"), you won’t get any errors/warnings. Pay very careful attention to the metrics documented by AWS (e.g. this doc for Load Balancer CloudWatch metric).
- Use the right statistic (e.g. choosing from: sum, average, minimum and maximum). For example, with HTTPCode_ELB_5XX_Count you want to know how many errors there have been in a given period so “sum” is most appropriate. The AWS console is not helpful here: it defaults to “average”.
- Carefully consider the “datapoints to alarm”. For example, you can say 8 out of 10 datapoints in the past 10 minutes. If there is automated remediation in place, you may want to give that a chance to fix the issue first (e.g. auto-scaling, or replacing failed servers)? If it’s a very temporary blip, you may not want to be immediately alerted: instead you might wait a few minutes to see if it resolves without your direct involvement.
Further Improvements
Using absolute error thresholds like this has problems: for example it would not detect the situation where the request rate was very low with 100% of requests having errors. Consider some better alternatives:
- CloudWatch anomaly detection will automatically establish normal baselines for your system, and notify you of anomalies. This can be very powerful.
- You could alert based on the error rate, rather than the absolute number of errors. You can do this with a metric math expression, for example dividing the 5XX count by the request count.
The AWS console for CloudWatch alarms and metrics is not the easiest to use for understanding the system’s overall state. It’s worth creating CloudWatch dashboards before you actually need it in anger; also run some game days to simulate problems and see how easy it is to diagnose problems. Good observability is far more than just metrics: you’ll also need logs and traces, and an ability to search and correlate these across different services within your system. There are a lot of other observability tools out there that work well with AWS - for example DataDog, New Relic, Dynatrace, Honeycomb, etc.
After an incident, best practice is to have a blameless postmortem to explore what can be improved and to prioritise these actions. It’s important to remove false positives to reduce alert fatigue, to ensure alerts do proactively notify you before customers complain, and to make sure that alerts are clearly actionable with good playbooks and runbooks.
Conclusions
Good monitoring and alerts are essential, but it can be fiddly to set up right in CloudWatch. Hopefully this blog helps by pointing out some important gotchas.
If you’re looking for assistance to improve your monitoring, alerting and observability then get in touch! As an AWS Advanced Consulting Partner, Cloudsoft will help you improve your operations fast, including reviewing, implementing and helping you upskill.